
Product Build 19 / 19
ArcVisual: complex research, clear visual understanding.
AI that turns research papers into visual explainers.
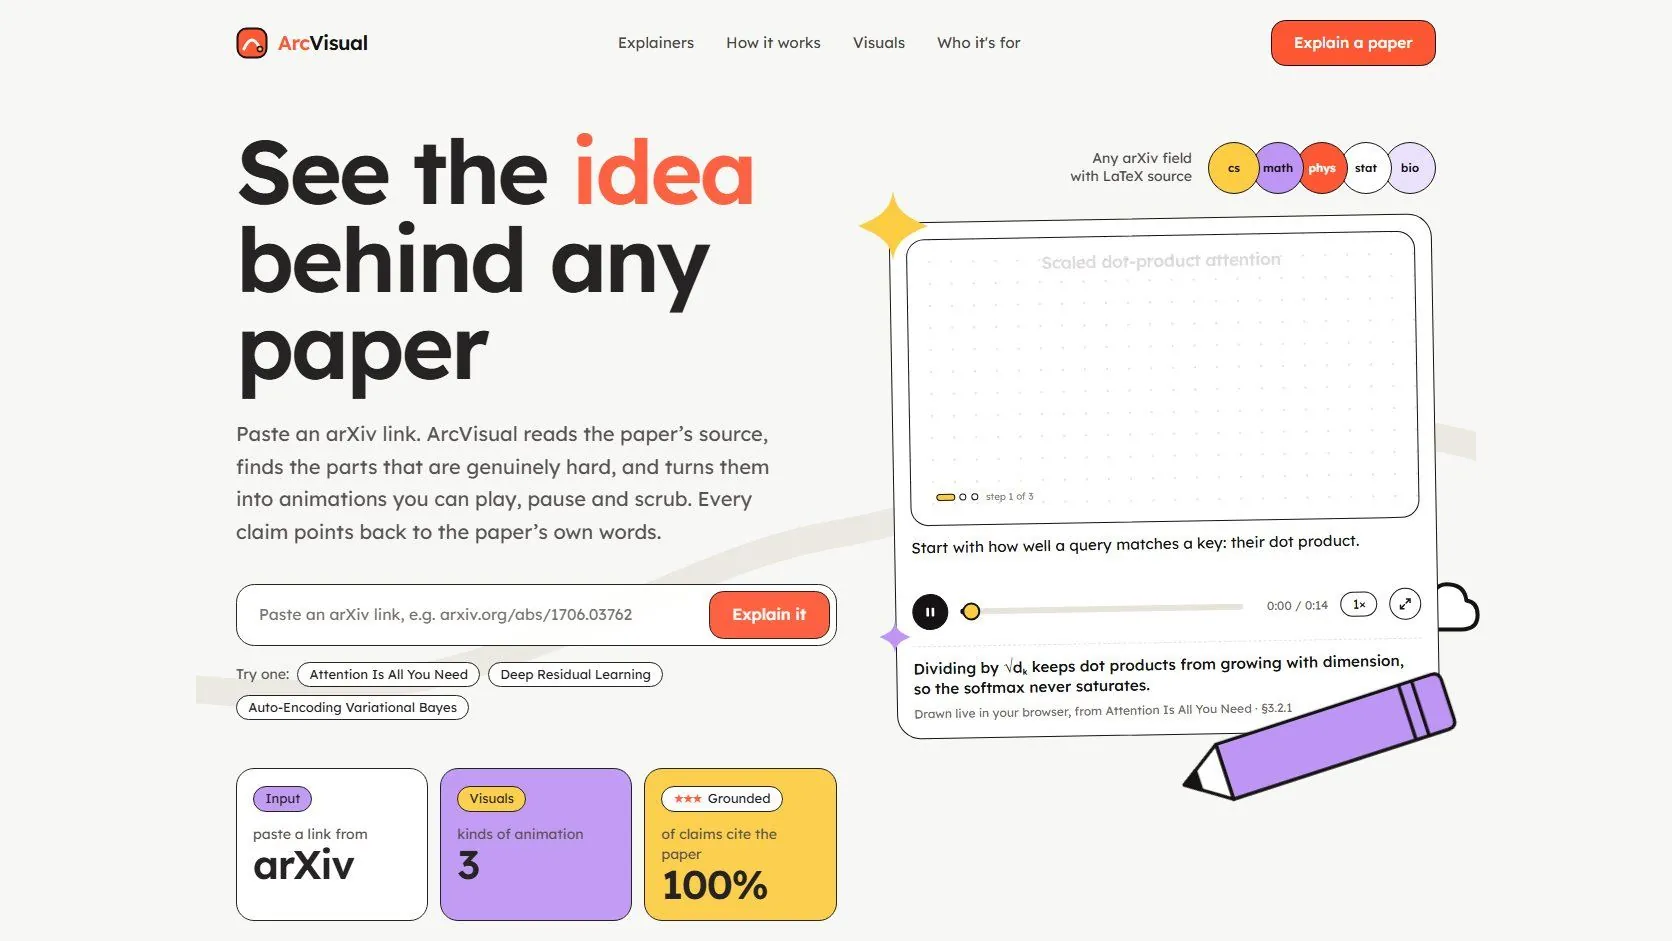
Explore the ProjectAboutArcVisual turns academic research papers into interactive, scroll-driven articles that combine AI-generated explanations, animated concepts and readable mathematical notation, so readers can explore research beyond a plain summary.
- Client
- ArcVisual
- Industry
- AI, EdTech & research tools
- Role
- AI product engineering & interactive web
- Type
- AI-powered web application
Project overview
A new way to experience technical research.
- Project
- ArcVisual
- Industry
- AI, EdTech, research tools
- Services
- AI product engineering, workflow automation, interactive web development
- Type
- AI-powered web application
- Technology
- Python, FastAPI, Next.js, React, PostgreSQL, AI model providers, KaTeX, Manim-based rendering
- Team
- Ishwra, with technical partner Jiyad Hussain
- Clients
- Not disclosed (confidential)
Paste an arXiv link and ArcVisual produces an interactive article. The platform connects document processing, AI concept analysis, structured visual generation, validation and a responsive reading experience in one pipeline.
The challenge
Research papers are written to be precise, not easy.
Papers mix dense terminology, equations and complex diagrams. A summary can shorten them without helping anyone understand how the ideas actually work.
Abstract ideas are hard to picture
Mathematical transformations and network architectures need more than words.
Useful visuals are hard to generate
AI-made scenes must be structured, readable and consistent, not just plausible.
Explanations must stay trustworthy
A convincing animation is worthless if it misrepresents the paper.
Objectives & strategy
Build a system, not a summarisation prompt.
- Step 01
Extract the source
arXiv LaTeX parsed into sections, equations, figures and metadata.
- Step 02
Find what needs explaining
Concepts analysed, and the ones that benefit from a visual selected.
- Step 03
Generate from templates
Reusable, parameterised visual templates instead of free-form animation code.
- Step 04
Validate before delivery
Structural, security, runtime and spatial-quality checks.
- Step 05
Present it interactively
Prose, rendered maths and scroll-driven scenes in a responsive article.
A shared Storyboard JSON contract connects the stages. The guiding rule: make complex ideas visible while the original paper stays the source of truth.
What we delivered
An integrated research-to-visual experience.
Structured AI pipeline
Processes the paper, identifies concepts, writes visual specifications and assembles the article.
Reusable visual system
Templates for concept diagrams, transformations, plots and architecture flows.
Interactive reader
A Next.js interface where readers can replay, pause, slow down or scrub the animations.
Quality control
Schema, code and security checks, render checks, spatial-coherence checks and a repair workflow.
Production deployment
A serverless API, PostgreSQL persistence and an in-browser scene renderer, with an optional Manim video path.
Results & impact
A working implementation, as reported in the repository.
- 10
- visual scenes generated for the Transformer paper
- 7
- visual scenes generated for the ResNet paper
- ≈4 min
- per paper in those runs, on Groq’s free tier
- 364
- automated tests documented
The visuals in both runs passed the first validation gate on their first or second attempt, and the reader was tested in a real browser at desktop and phone widths.
These show a working pipeline; they do not by themselves prove gains in comprehension or time saved.
Quick answers
ArcVisual, in brief.
Something we did not cover? Ask us directly and we will reply within 24 hours.
What did Ishwra do for ArcVisual?
ArcVisual turns academic research papers into interactive, scroll-driven articles that combine AI-generated explanations, animated concepts and readable mathematical notation, so readers can explore research beyond a plain summary.
Which industry is ArcVisual in?
AI, EdTech & research tools. It is part of our AI & SaaS Products work.
How does ArcVisual keep explanations accurate?
It builds visuals from structured templates, validates every scene before delivery, and keeps the original paper as the source of truth for each claim.
Can Ishwra do a similar project for my business?
Yes. This project used our AI Integration & Automation, Custom Software & Mobile Apps services. Tell us about your business through Discuss a Project and we reply within 24 hours.
Related capabilities & projects
View all projectsAI Integration & Automation
WhatsApp bots and workflows that answer customers without retyping.
Custom Software & Mobile Apps
Web apps, back ends, dashboards and APIs built around your workflow.
AI & SaaS Products
What we build for this sector, with its other case studies.
VaayuNetra
Satellite AI for landfill methane